
Automated sentiment in Mediaportal helps to quickly gauge the tone of conversations you are tracking and identify brand perception.
Sentiment grading works using NLP (Natural Language Processing). The technology attempts to understand the overall attitude (positive or negative) expressed, and grades clips inside Mediaportal accordingly.
This article has information about how automated sentiment inside Mediaportal appears, and how it can be used to analyse coverage. There’s also a downloadable quick guide for automated sentiment here.
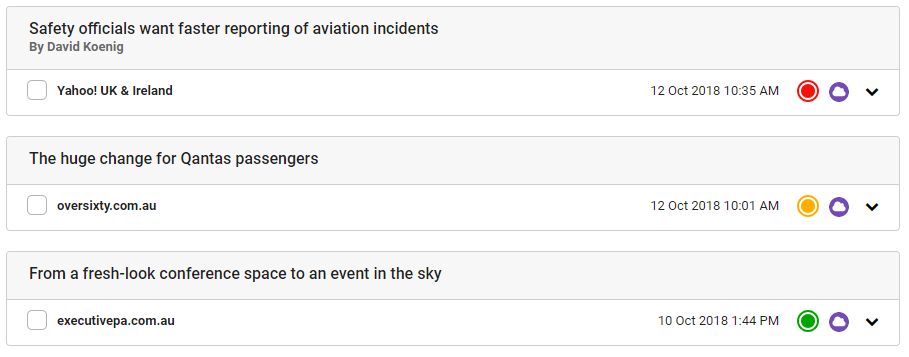
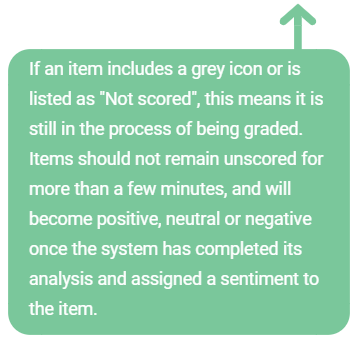
When viewing media items inside Mediaportal, you will see automated sentiment grading appear on each item as either a green, amber or red coloured icon representing positive, neutral , or negative sentiment.
Manual Override
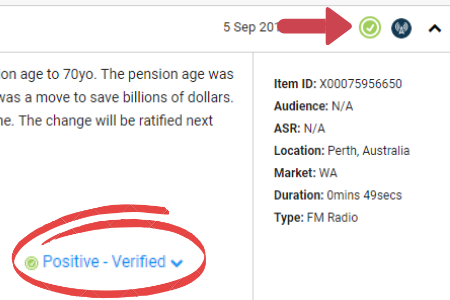
Assigning sentiment to a document always involves some element of value judgement. If you decide that the sentiment of an item is different to the sentiment badge on the media clip, you can use one of the two manual override buttons to change the sentiment.
![]()
Any clips that have been manually verified will include a check mark on the sentiment badge, and “Verified” label will appear on the override tab.
Group by sentiment
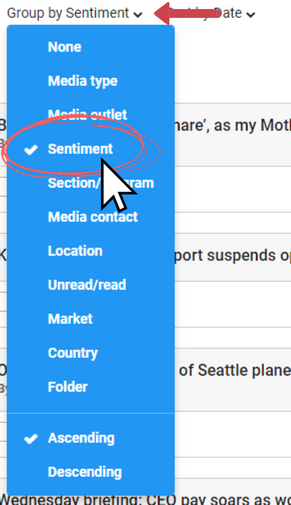
To quickly see how much of the coverage in your briefs or folders is positive, negative, or neutral, items can be group by sentiment using the “Group by” drop-down in a brief or folder.
Search by sentiment
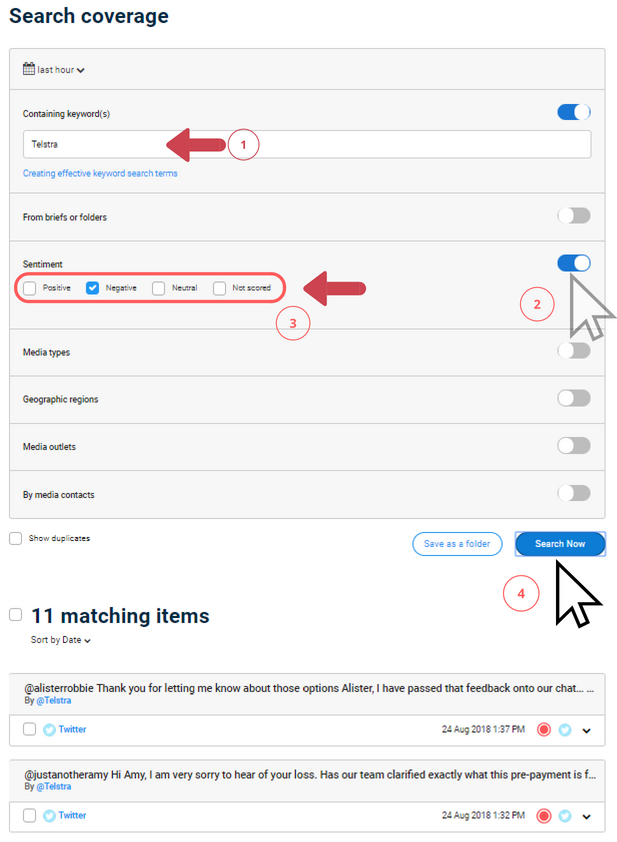
Using the “Search in Coverage” tool in Mediaportal, you can filter your search by a positive, negative, or neutral sentiment to help you identify the tone of particular issues.
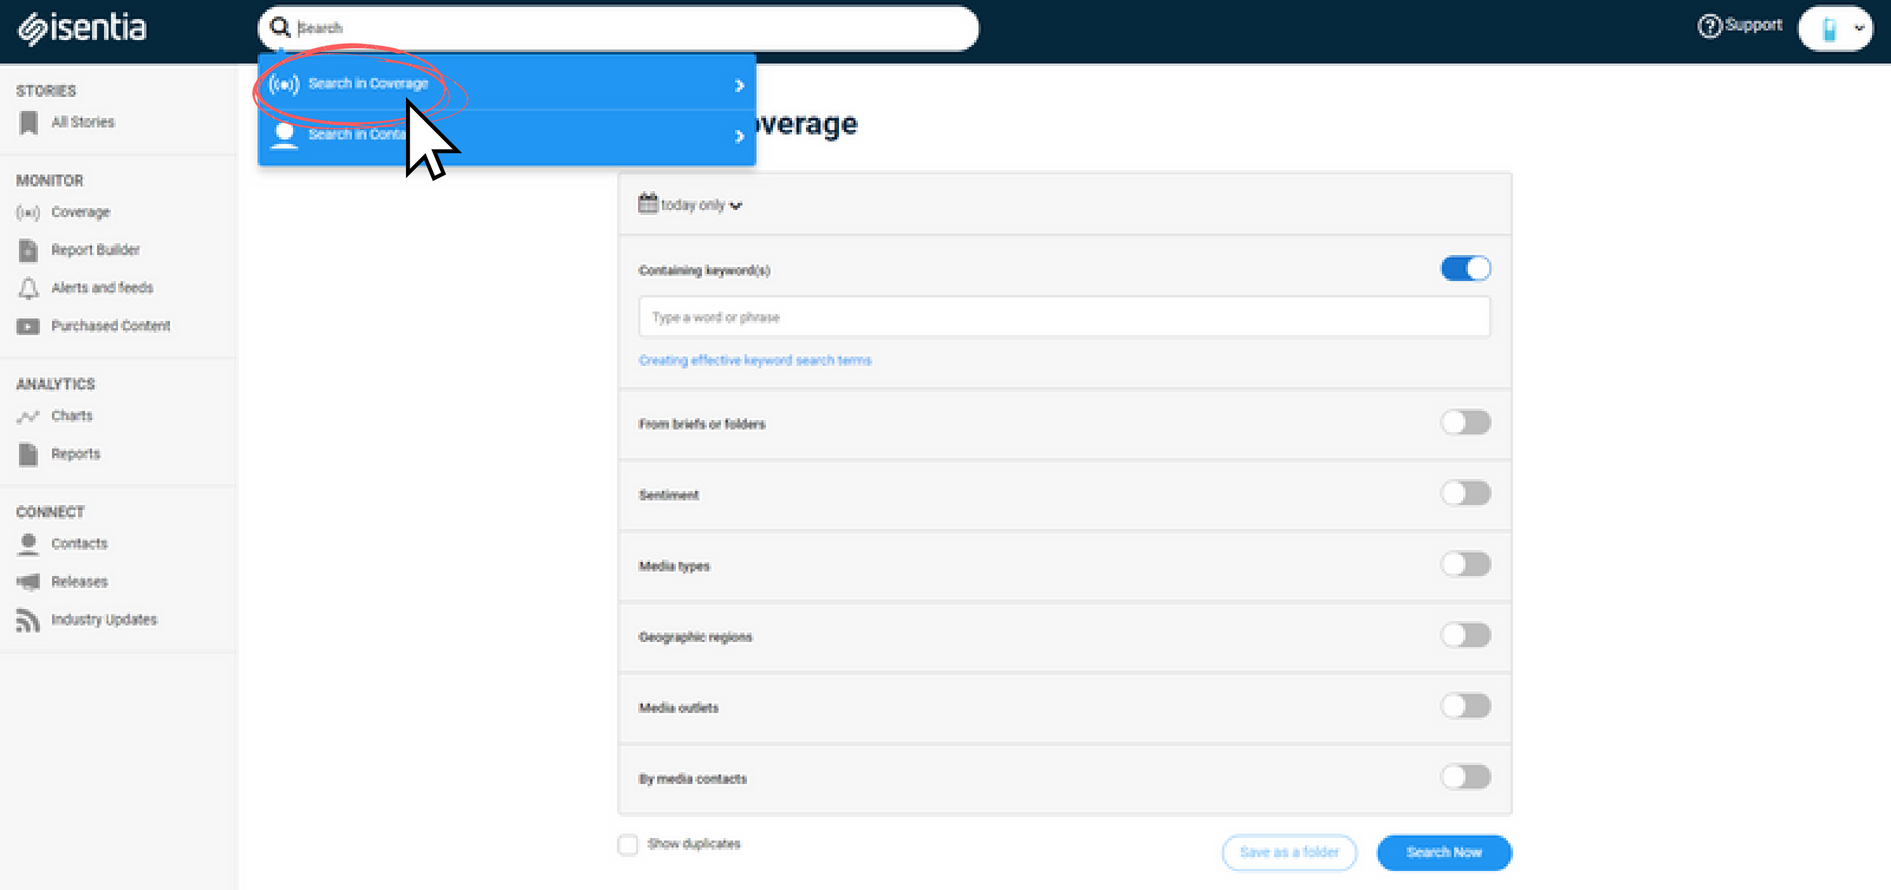
For example, you can search on the name of your brand or organization and filter by negative sentiment to help identify if there is any negative brand perception.
To do this, type the keyword you would like to search for into the “Containing keyword(s)” field. Then, switch on the sentiment filter and select the “Negative” checkbox. You can also apply other filters for a more specific search before clicking “Search Now”. To find out more about searching coverage you may like to read this article How To: Search Coverage.
Sentiment in Custom Reports
Coverage that has been graded can also be included in your media reports using the Custom Report builder.
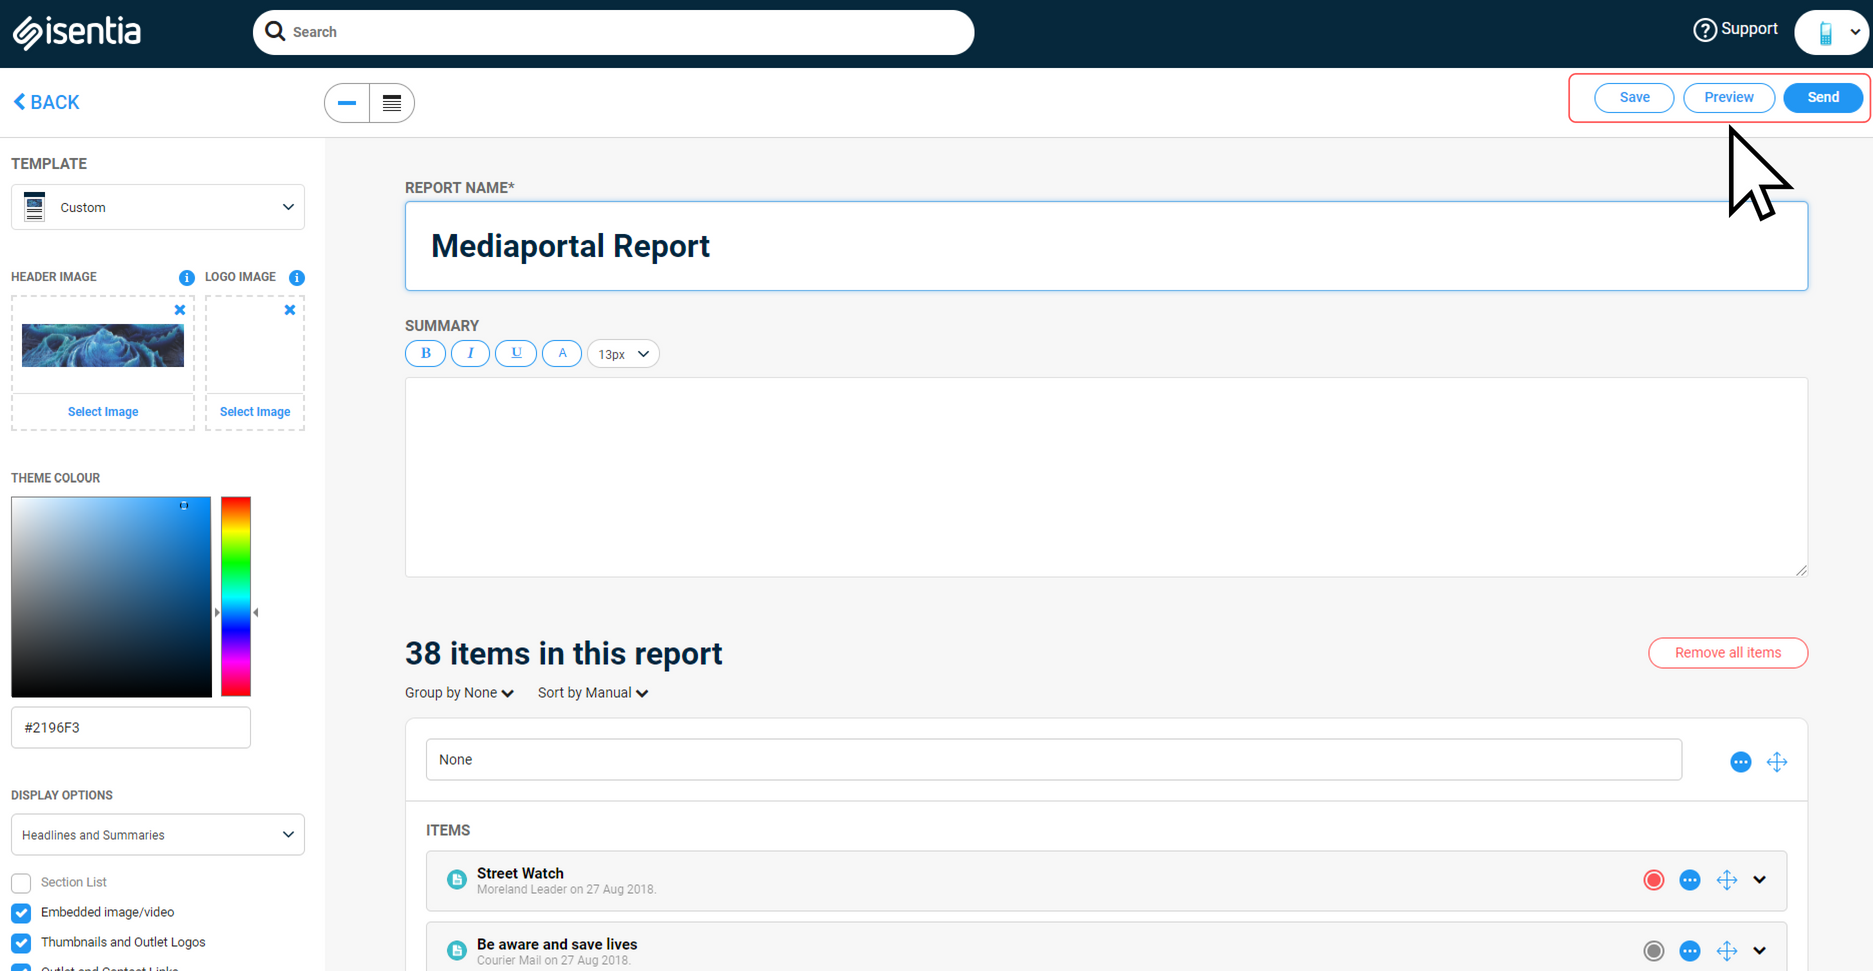
Building a report with sentiment included is the same process as building your regular Custom Reports. First, select the items you would like included and add them to the report builder.
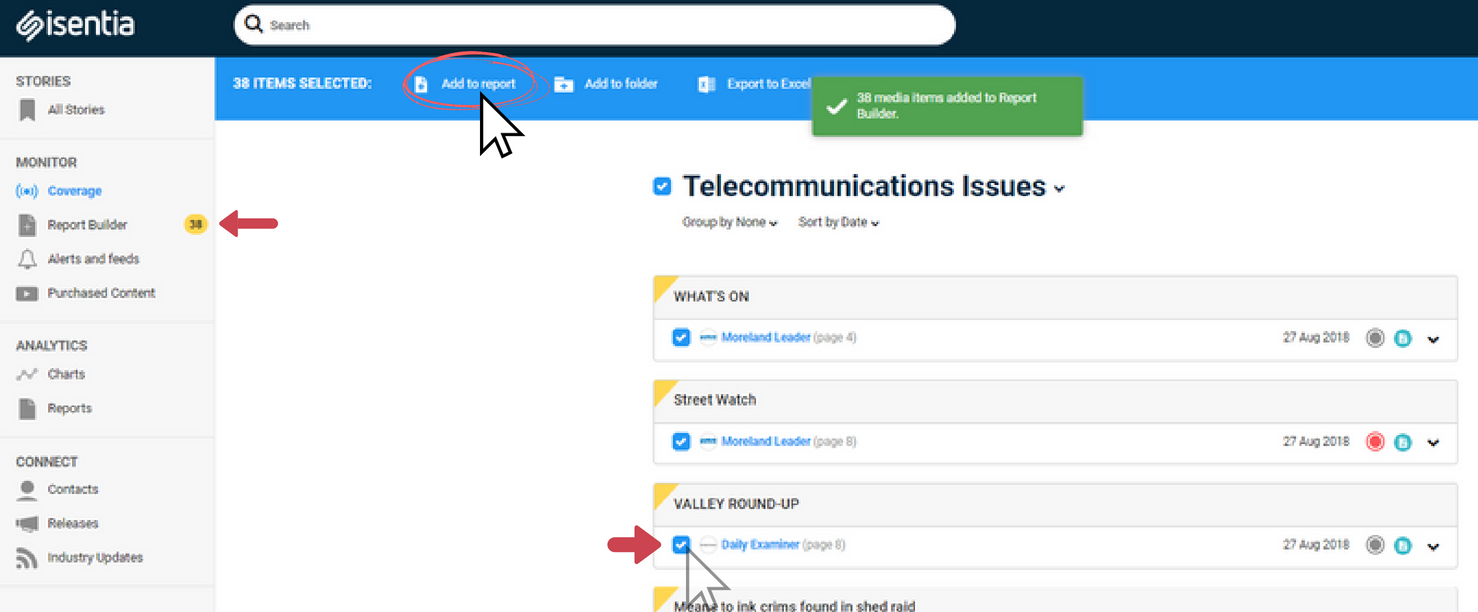
Go to the report builder by selecting it from the left navigation panel, and then in the report builder page select the sentiment check box on the left under display options.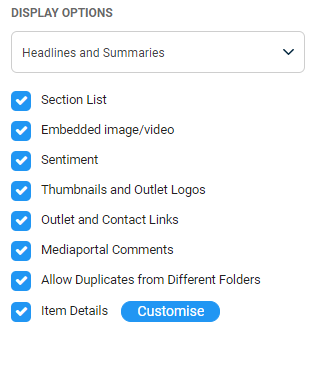
Once you have chosen all of your other report options, click “Save”, “Preview”, or “Send” to build the report.
Sentiment icons will appear on each media item in the report you have created. You can read more information about how to build Custom Reports in this article How To: Coverage Reports (Custom).
Personal folders with sentiment
Using personal folders, you can automatically file your coverage into separate folders by sentiment. This can be very useful for quickly identifying sentiment associated with specific topics such as brands, campaigns, spokespeople, crisis and more.
The sentiment filter can easily be applied to any new or existing personal folder with the toggle in the folder’s settings.
To find out more about setting up personal folders or changing settings of an existing folder you may like to read this article How To: Folders (Personal Folders)
When building a new personal folder or updating the settings of an existing folder, you will see the sentiment filter appear as an option in the “Folder criteria” list. To apply the sentiment filter, click on the toggle and select the grading you would like your coverage to be filtered by.
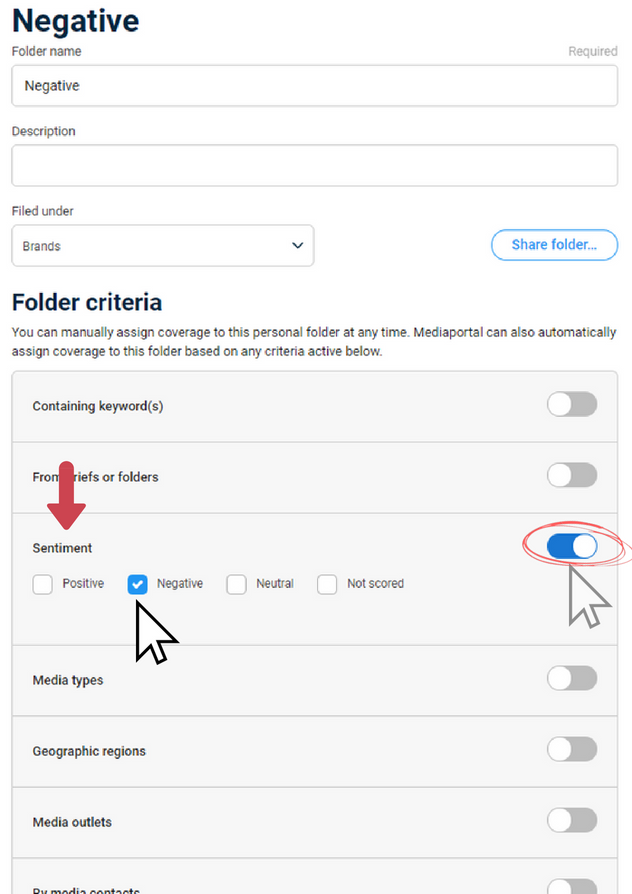
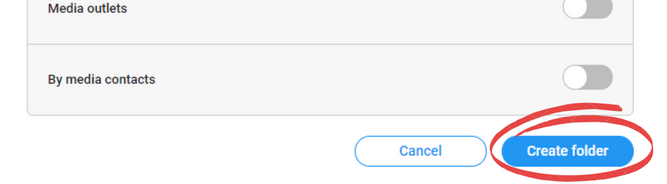
Click “Create folder” (when creating a new folder) or “Update” (when updating an existing folder) at the bottom of the page once you are happy with the criteria you have chosen.
Analysing sentiment
Personal folders can also be used to analyse the sentiment of your coverage further in the Analytics section of your Mediaportal.
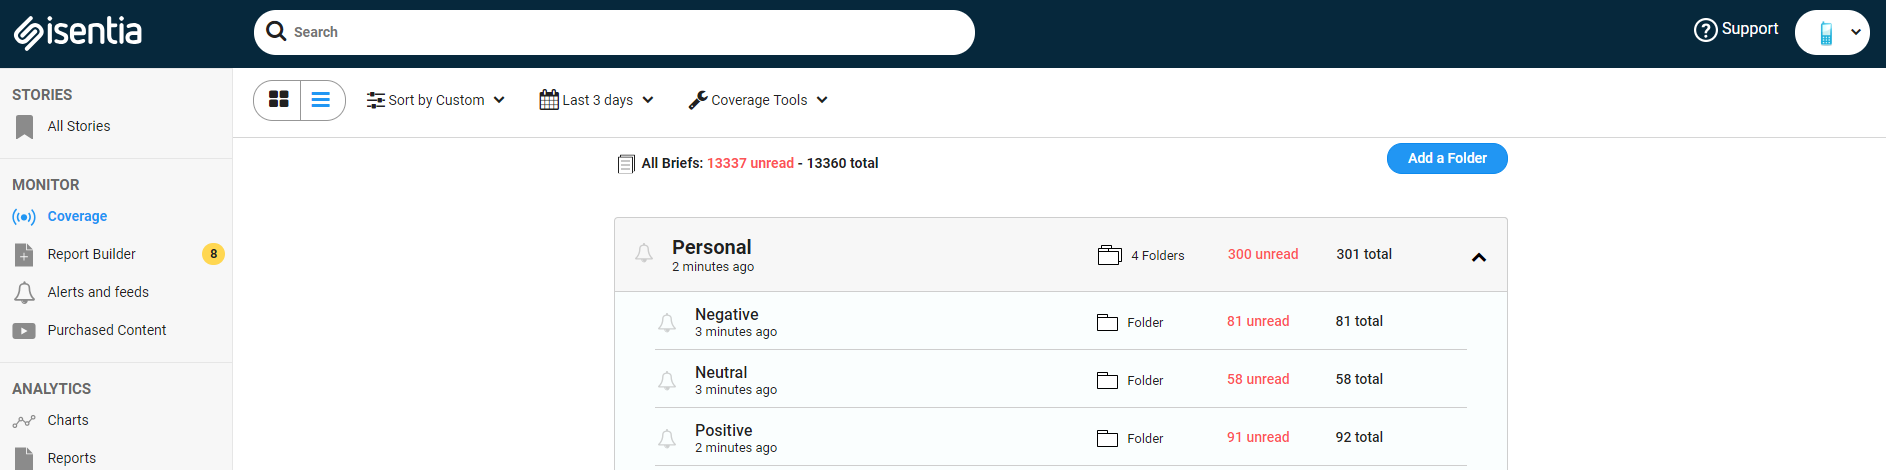
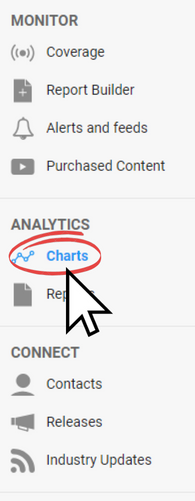
Once you have setup some positive, negative, and neutral personal folders, you can click “Charts” in the left navigation panel to create a dashboard for breaking down the sentiment volumes.
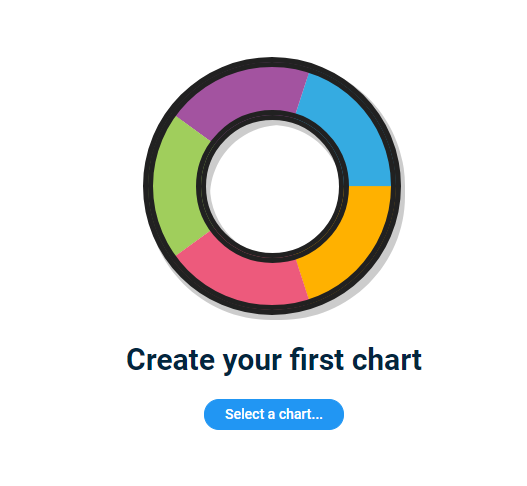
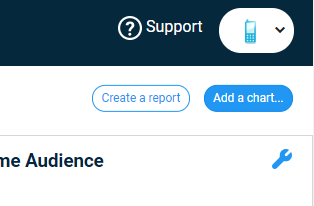
If you haven’t already created a chart on your Mediaportal dashboard, you can click “Select a chart” to start building your first one. If you already have some charts on your dashboard, you can add a new one by selecting the “Add a chart” button at the top right corner of your page.
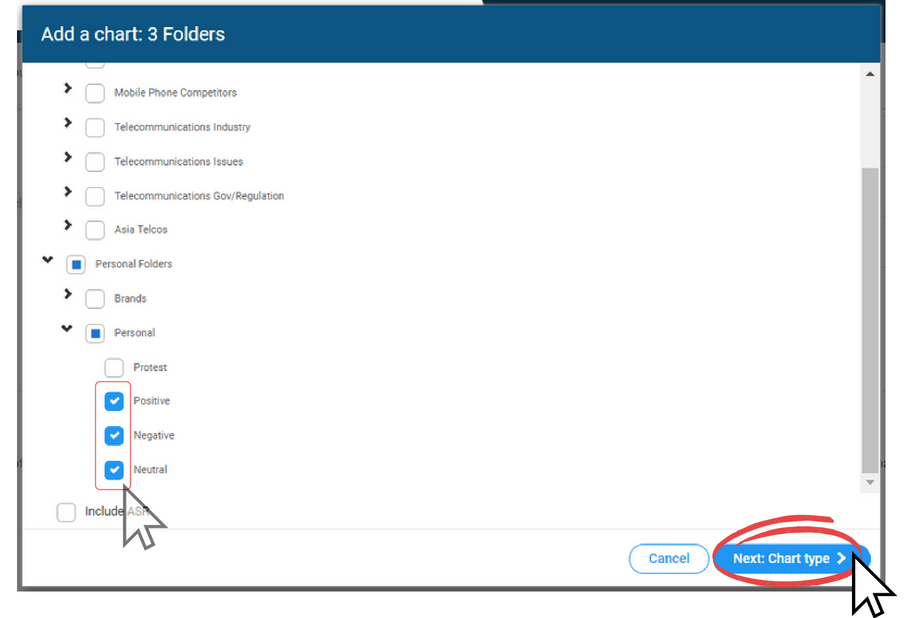
In the chart builder, select the sentiment folders you created to compare and then click “Next: Chart type”.
In the chart type drop-down there are four chart templates that are most useful for comparing your sentiment folders:
- Folder breakdown
- Folder comparison
- Folder trends
- Media type by folder
The best data set option for analyzing sentiment is “Volume”, but you can also analyse your folders by audience or ASR rate.
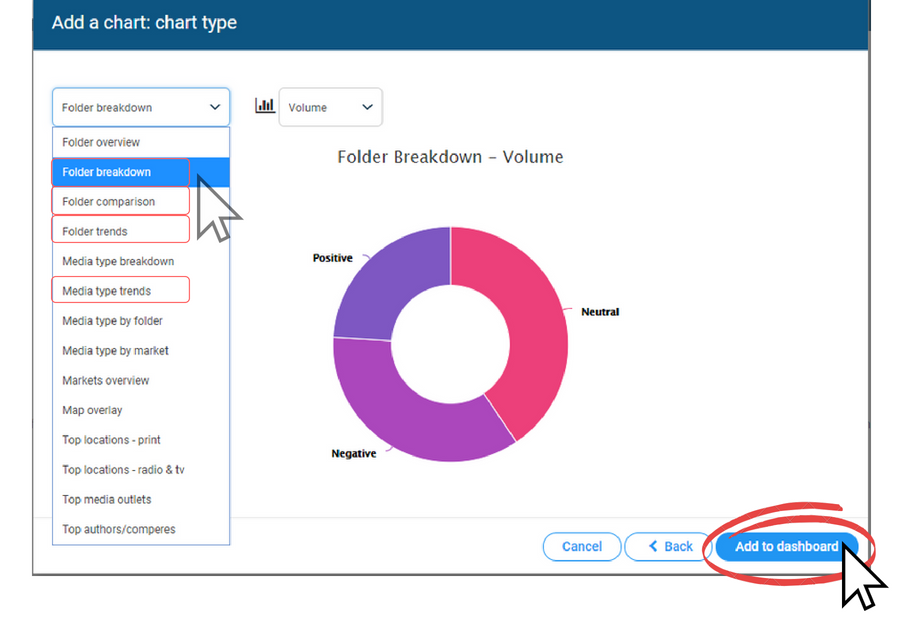
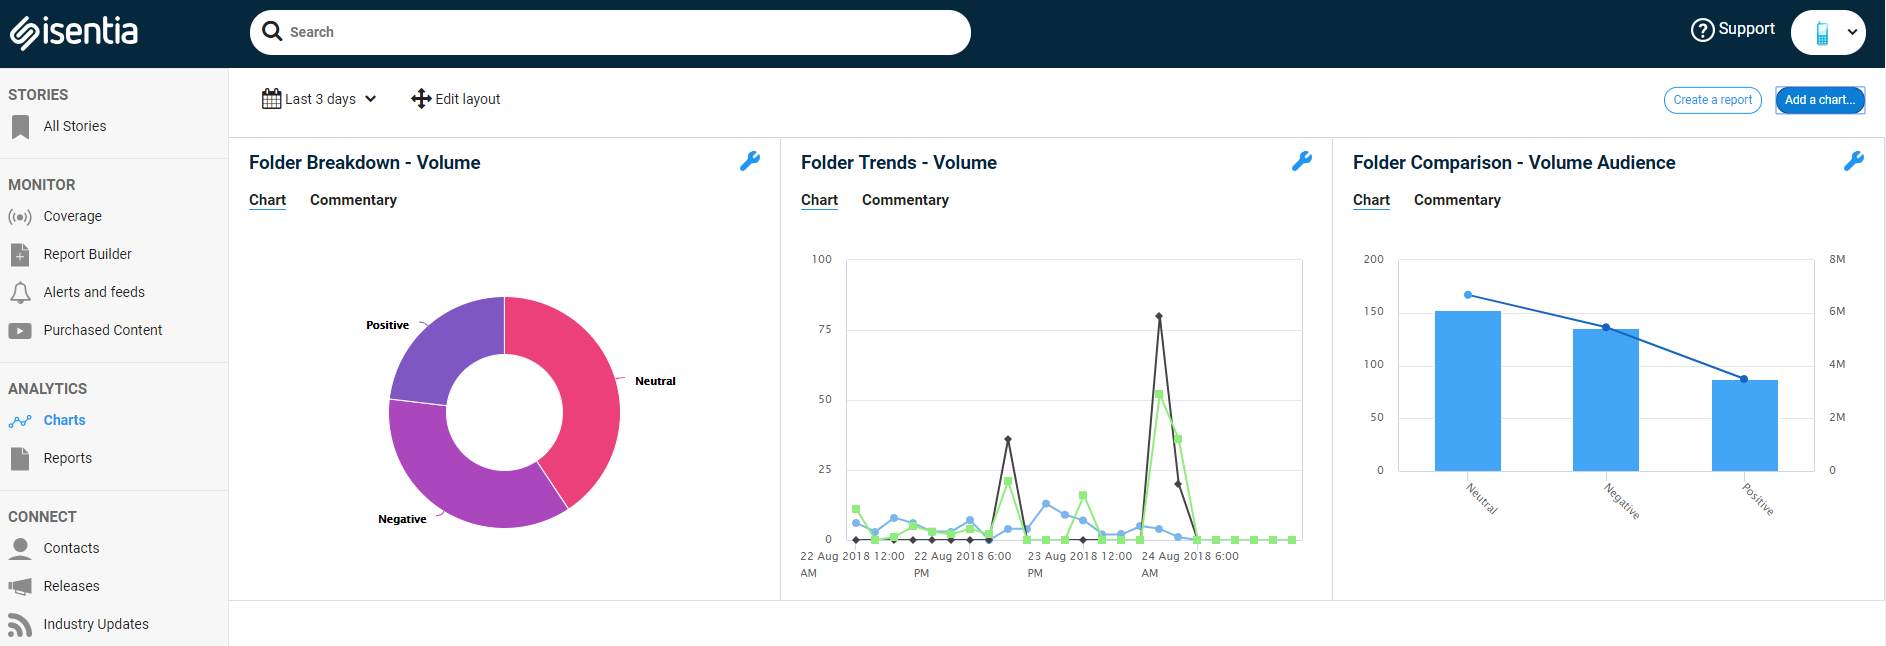
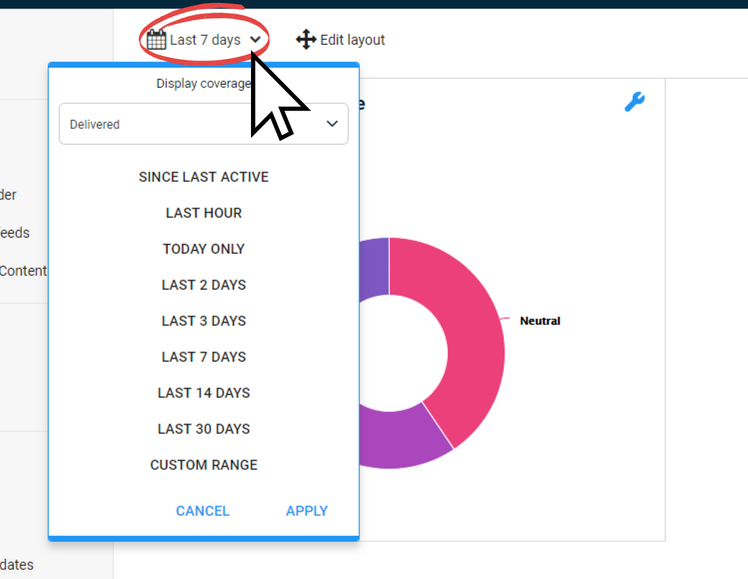
When you are happy with the chart, click “Add to dashboard” to finish. The chart/s on your dashboard will update based on the date range you have selected. To change the date range, select the date picker at the top of the page and choose your preferred date.
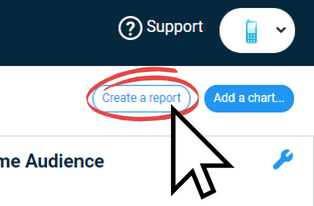
All charts on your Analytics Dashboard can be built into a single PDF report by clicking on the “Create a report” button at the top right corner of your page. This allows you to produce a single report with multiple insights from different charts.
To find out more about using Mediaportal Analytics to chart your coverage, you may like to read this article How To: Analytics Reports.